Tutorial: [only for the desktop version] follow the magnifying lens (on the left besides to this text in a maximized browser.)
Discussion: Discovering Entities #3, video: Entity Extraction of free (English) text.
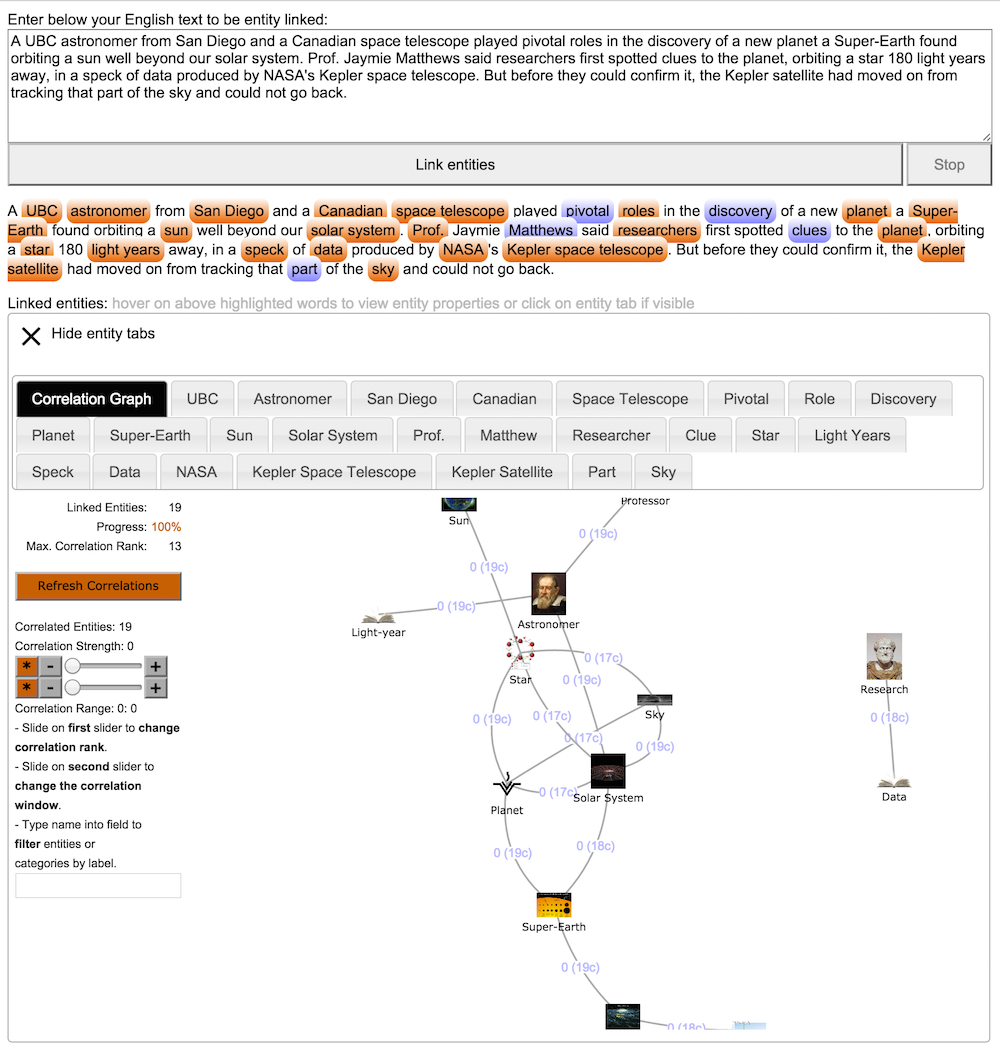
This demonstrator analyses the text in the text area, linking nouns with a logically linked data space and tagging linked nouns with respect to the discovered entities, showing for each tagged noun the corresponding entity and its RDF records (triples) found in DBPedia. This is the first and most sensible step inside an ETL process /etl/. The demonstrator discovers semantic correlations between concept pairs on the basis of a SKOS taxonomy taken from DBPedia. This demonstrator was realized using the Linked Data source DBPedia hosted in one of the current best RDF Triplestores – Blazegraph™.
Let yourself go (notes)
– Each HTML5 supporting device will be able to run this demonstration (best if Chrome, Safari on Desktop with at least 8GB main memory – for graphics).
– The data for this demonstration are taken from the DBPedia 2014 dataset – Please note that the use of this dataset is for pure demo convenience only, since it is a quite complete dataset. Of course we would be happy to mount „your“ data set as a basis for this technology.
– The provided demonstrator runs on a dedicated server without a NIS registration. In some cases when company policies are restrictive the url of this dedicated server will be blocked. Please access this page then from another place without these restrictions.
– The provided service is connected via IP to the demonstration page. In case of connection problems we will not be able to provide this service. We ask for your understanding.
– Entities are linked as they are found in the triplestore. Some results could be funny because they were found for the given text token.
– We thank DBPedia for providing these datasets but do not feel responsible for any data corruption or peculiarity found in them. We ask for your understanding.
Quick Start
- Choose an English text source
- Copy one or some phrases into the text area
- Press the orange button
- Examine the RDF results for each entity
- Examine/interact with entity correlations in the Correlation Graph
- Navigate/interact with subjects/categories in the "Categories" entity graph
- Navigate/interact with subjects/categories in the "Correlations" entity graph
- Use the provided samples
|
|
|
Details
- Take any English text you might find - for example from a newspaper.
- Select some phrases into the text area (max. 2500 characters).
- Press the orange button and wait until all the words of your text are examined.
-
The RDF results are displayed pro entity in an own tab. Tabs can be hidden in case they take too mach space on the page. Change from entity to entity by mouse hovering on entities or click on a tab if tabs are visible. Please scroll all RDF results to the bottom in order to see all results pro entity.
- The Correlation Graph shows the entities linked from the English text - except the disambiguations. Pressing the button "Compute Correlations" the Entity Linker builds entity pairs and computes correlating categories for it. Each correlation is shown by an arc between two entities/categories. Click on one arc to see the closest general categories in common to the pair. Include some categories into the Correlation Graph to (automatically) see new correlations. Reduce the graph view by sliding the rank slider or by typing one entity name (part).
- The "Categories" entity graph shows the central entity in the middle and its categories connected by edges. Expand a concept in the graph by double clicking on it. After expansion the concept is put in the middle of the graph view and its new expanded concepts are automatically rearranged. An expanded concept is shown with the number of loaded sub concepts in parenthesis. Categories are represented by orange dots, entities by white dots. Zoom in the graph using your mouse wheel with the mouse on the graph; translate one node by dragging the node; translate the whole graph by clicking on a white area and dragging. Visualize an entity by simple clicking on it: a new tab will be opened with the entity description.
- The "Correlations" entity graph show the central entity in the middle and a (still hypothetical) connection to each of the linked entities around it (each concept here in blue). Expand by double clicking each entity like in the "Categories" graph. Additionally to the "Categories" graph you can here "explore" by - double clicking the arc - an hypothetical connection (Correlation) between two concepts. In case of success further concepts (Similarity and Difference categories) will be connected betwen and around the two chosen concepts. In case you do not yet see a concept as hypothetical connected with the central concept, click on the missing concept (opening a new tab with its description); this concept will be automatically added to the central one to allow correlation exploration.
- Examples of English text sources: astronomy.com/news or nytimes.com
Or you might try directly using the text below:
A UBC astronomer from San Diego and a Canadian space telescope played pivotal roles in the discovery of a new planet a Super-Earth found orbiting a sun well beyond our solar system. Prof. Jaymie Matthews said researchers first spotted clues to the planet, orbiting a star 180 light years away, in a speck of data produced by NASA's Kepler space telescope. But before they could confirm it, the Kepler satellite had moved on from tracking that part of the sky and could not go back.
Joseph Mallord William Turner 23 April 1775 19 December 1851 was an English Romantic landscape painter, watercolourist and printmaker, whose style can be said to have laid the foundation for Impressionism. Although Turner was considered a controversial figure in his day, he is now regarded as the artist who elevated landscape painting to an eminence rivalling history painting.
In 1700 the Spanish line of Habsburgs was extinguished with the death of Charles II. After his death, the War of the Spanish Succession began in 1701 with the occupation of all Spanish possessions by French troops backing the claim of the French Philippe of Anjou to the Spanish throne. In 1706, the French were defeated in Ramillies and Turin and were forced to yield northern Italy to the Austrian Habsburgs. In 1713, the Treaty of Utrecht formally confirmed Austrian sovereignty over most of Spain's Italian possessions including Lombardy and its capital, Milan.
|

All rights reserved.
Click to magnify the picture
Please enlarge your browser page or reduce the zoom if you do not see the whole magnified picture.")