\"")
June 2015
SKOS based Clustering of RDF Entities in Knowledge Graphs
This document is intended for an audience working with computer text assistance, which are using / seeking for details of linked entities in a knowledge graph starting from a natural language text. Please refer to a prior blog /SWEL15A/ to get the start of this discussion.
Nowadays we are literally overflown with huge amounts of records, notes, emails, documents, and news. The challenge often is keeping the balance between our working duties and the information overflow, synthesising – or even better: reading already synthesised – “essentials” on topics concerning our personal or enterprise focus. Since our “domestic robot” is not always able to prepare for us the needed pieces of information – most of us have to do it nowadays still by themselves. Couldn’t we be positively surprised by having – at reading time – automatically all the entities that piece of news is speaking about on a silver tablet completed by their definitions, details and related entities to be (on demand) browsed. That is what “Entity Linking” stands for: Recognising rigorously and in a detailed way Entities in a knowledge graph from the piece of information which is just entering “the horizon” – a natural language text.
Once entities are linked we have the enormous advantage that all the information around them are also linked. The system leverages the information degree by showing (on demand) further linked entities: more entities get easily discoverable.
As already mentioned in /SWEL15B/, Correlating (two) entities inside an RDF space means in this work finding some shared properties for the entity pairs. Ontological spaces define each entity giving (any of) the following properties:
1) Attributes of the entity (like population for a city) – owl:partOf
2) Subparts of larger entities (like a table for a table-leg) – owl:partOf
3) Subparts entities (like a leg for a table) – owl:hasPart
4) Links to similar entities – owl:sameAs
5) Links to one or more categories – dcterm:subject
6) One or several types – rdfs:type
7) One or several relationships to other entities – “is dbpedia-owl:product of”
In this context /SKOS/ takes a central role as a basis for correlations thanks to its transitive relations like
8) More general – skos:broader
9) More specific – skos:narrower
10) Related – skos:related
In particular using the skos:broader relation a correlation of two or more entities can be easily done by finding first common general categories including the same entities. The only prior work on which these thoughts rely is a consistent thesaurus/taxonomy subset in the used ontology. In the next chapter I will demonstrate how this can be realised with a demonstrator which allows showing and manipulating entities correlations.
The Entity Correlator /ELD2015/ constructs for each of the linked entities one tab. Each tab presents two graphs named “Categories” and “Correlations”. The “Categories” graph was the original only graph of this Entity Linker. The first of all tabs is the main “Correlation Graph” where all linked entities are collected and correlated. As input text I took the following astronomy piece of news:
„A UBC astronomer from San Diego and a Canadian space telescope played pivotal roles in the discovery of a new planet a so-called Super-Earth found orbiting a sun well beyond our solar system. Prof. Jaymie Matthews said researchers first spotted clues to the planet, orbiting a star 180 light years away, in a speck of data produced by NASA’s Kepler space telescope. But before they could confirm it, the Kepler satellite had moved on from tracking that part of the sky and could not go back. And so they turned to Matthews, who also oversees Canada’s small but effective space telescope called MOST, which stands for Microvariability and Oscillations of Stars satellite Matthews and his team pointed MOST in the right direction and saw the light level of the star dim slightly as the planet passed between it and the space telescope.“
Figure 1 shows the general correlation graph with the 27 linked (uncorrelated) entities, while figure 2 shows a view on correlated entities after the correlation work started by the user. Each correlation is associated with a “rank” and is given by the existence of common SKOS general categories on each pair of entities. Since entities are themselves contained in categories and the latter are included in the transitive SKOS “more general” relationships, entities and categories can be correlated.
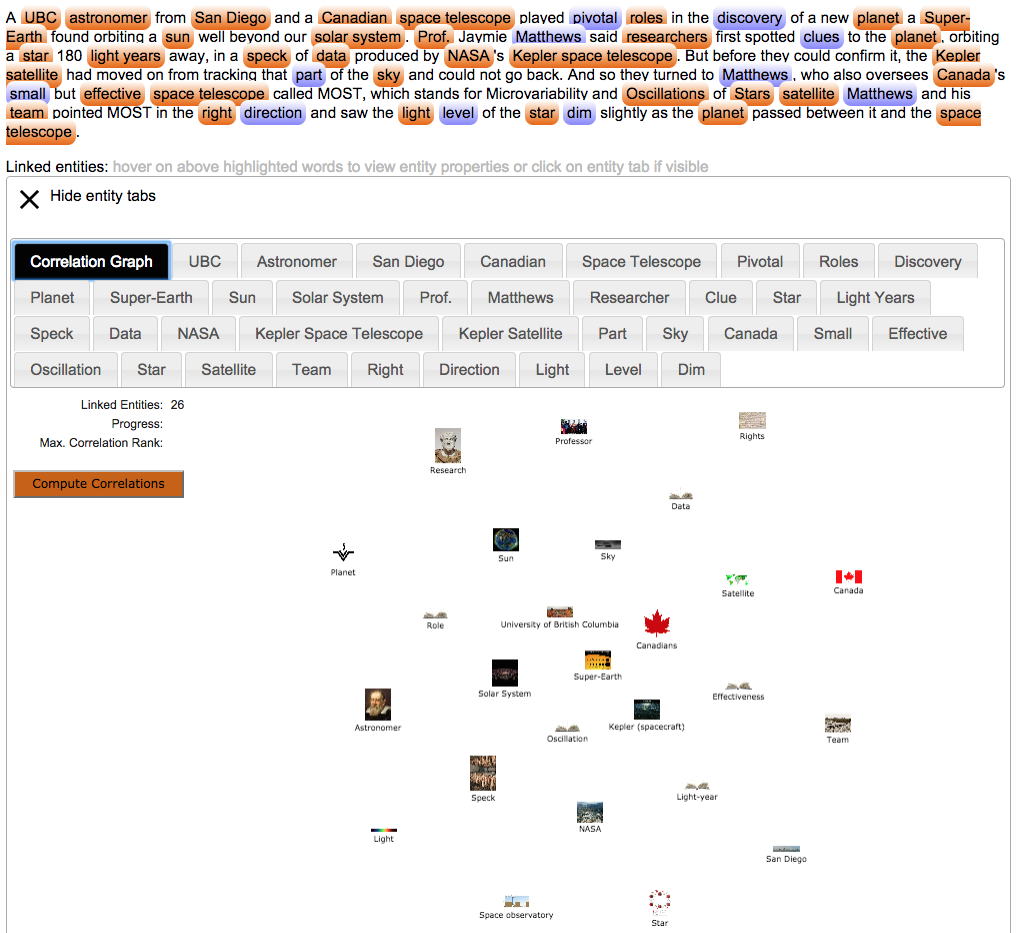
Figure 1 – General correlation graph with 27 linked (uncorrelated) entities.
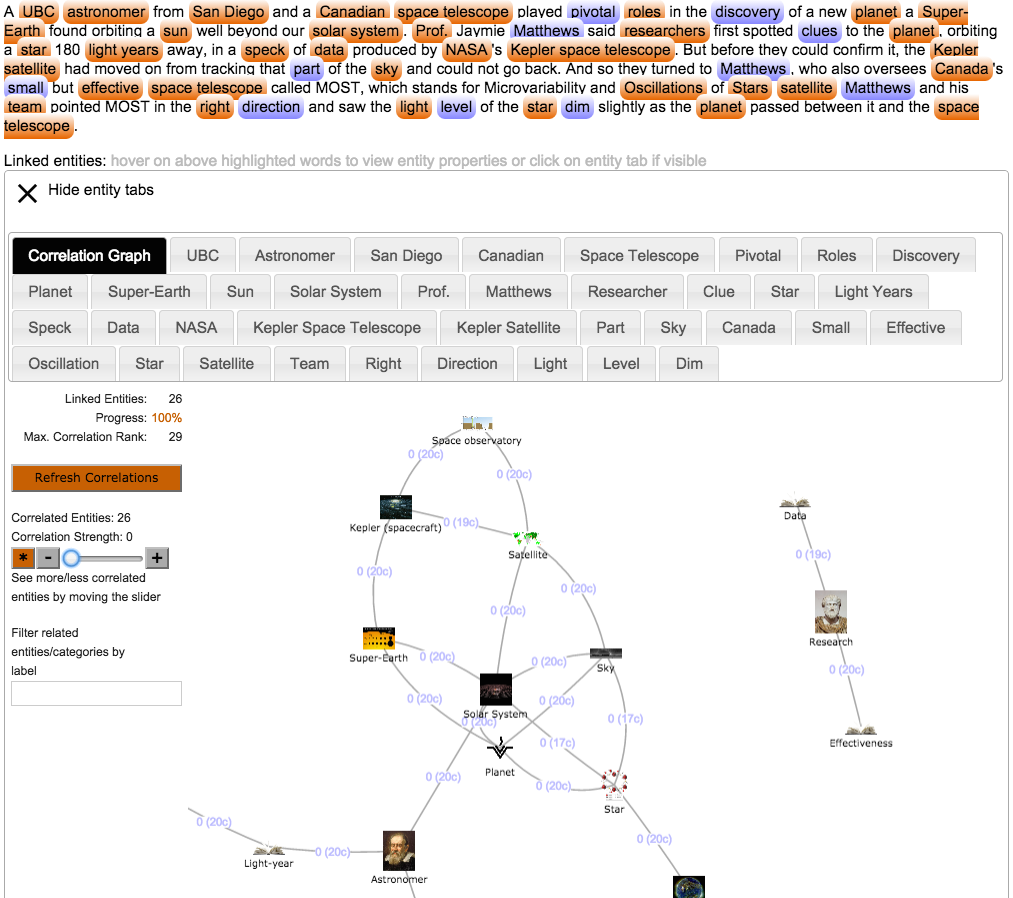
Figure 2: General correlation graph with 27 correlated entities showing only correlations with rank 0 (direct correlations).
The Graphical Challenge
I chose a visual graphical representation in order to facilitate exploration of the focused portion of the knowledge graph. The used visual graphical implementation (visjs /VISJS/) delivers a graph, which automatically organises itself after nodes and arcs are added. This organising work is done by the graph inside the browser. Although visjs is a very efficient implementation of a visual graph it still takes some reasonable time to reorganise nodes when the number of nodes/edges exceeds 100 elements. In order to realise the maximal usability in the visualised portion of the knowledge graph, I introduced two controlling elements:
1) Reducing the view by moving a correlation rank slider
2) Reducing the view by name filtering
1) and 2) help the user finding by exploration the focused nodes/edges in the graph if the user knows some node name or rank to be set. On the other side it allows an exploration of (portions of) the components of the graph. A graph with several nodes and edges might be still unreadable. Name filtering on a non bi-dimensional graph (with several crossing edges) reduce the number of the shown correlations and entities, thus permitting a clear view of what entity relation is on focus inside the graph.
Clusters of entities as MSC
In Figure 2 two maximal strongly connected subgraphs (MSC) /MSCSG/ can be recognised: i) an MSC containing “Research”, “Effectiveness” and “Data”. and ii) another MSC containing “Solar System”, “Astronomer”, “Professor”, … Each MSC connects de facto one cluster of entities inside the same knowledge graph with respect to the input English text. These MSC’s were computed finding an appropriate value for the maximal allowed correlation rank. The rank of a correlation is the minimum of the distance mean between the entities and their more general categories.
Disambiguations
Note that disambiguation entities like “pivotal” or “discovery” (corresponding to the blue tags above the entity tabs) are not present in the main correlation graph view – see figure 1. The reason is because a disambiguation entity “d” is de-facto a non-entity. A disambiguation entity is a knowledge graph object, which is connected to its “more real” entities, one of them should be chosen for “d” (I left an automatic disambiguation step open in this demonstrator.) In case a disambiguated entity for “d” be necessary in the correlation graph, it can be 1) viewed in the corresponding tab for “d” and 2) a disambiguation entity connected with “d” can be opened directly from the graph (e.g. “Pivot element” as disambiguation of “Pivot” – found for “pivotal” in the English text) – a new tab on the disambiguated entity is then opened and all graph entities/categories are automatically correlated with “Pivot element” in the general correlation graph. Figure 3 shows a portion of the result of adding “Pivot element” in the correlation graph; it shows a view on the entity “Professor” and its connections gained through name-filtering using an appropriate text field below the start button and a rank of 8.
Adding more Categories to the Correlation Graph
Every correlation is visualised as an arc between two entities/categories. Figure 4 shows the same view centered on the entity “Professor” using a maximal correlation rank of 8. Clicking on one correlation arc – e.g. between the entities “Professor” and “Pivot element” – shows a view on the top 20 most important correlating categories in the same order as they were found in the Knowledge Graph: first “Social systems”, then “Sociology”, … up to some more general categories like “Life” which are all containing both entities “Professor” and “Pivot element” inside to the used SKOS taxonomy. The user can add one or more correlating categories to the main correlation graph. Similar to the previous disambiguation step, each added category is added and correlated to each of the entities/categories already present in the correlation graph.
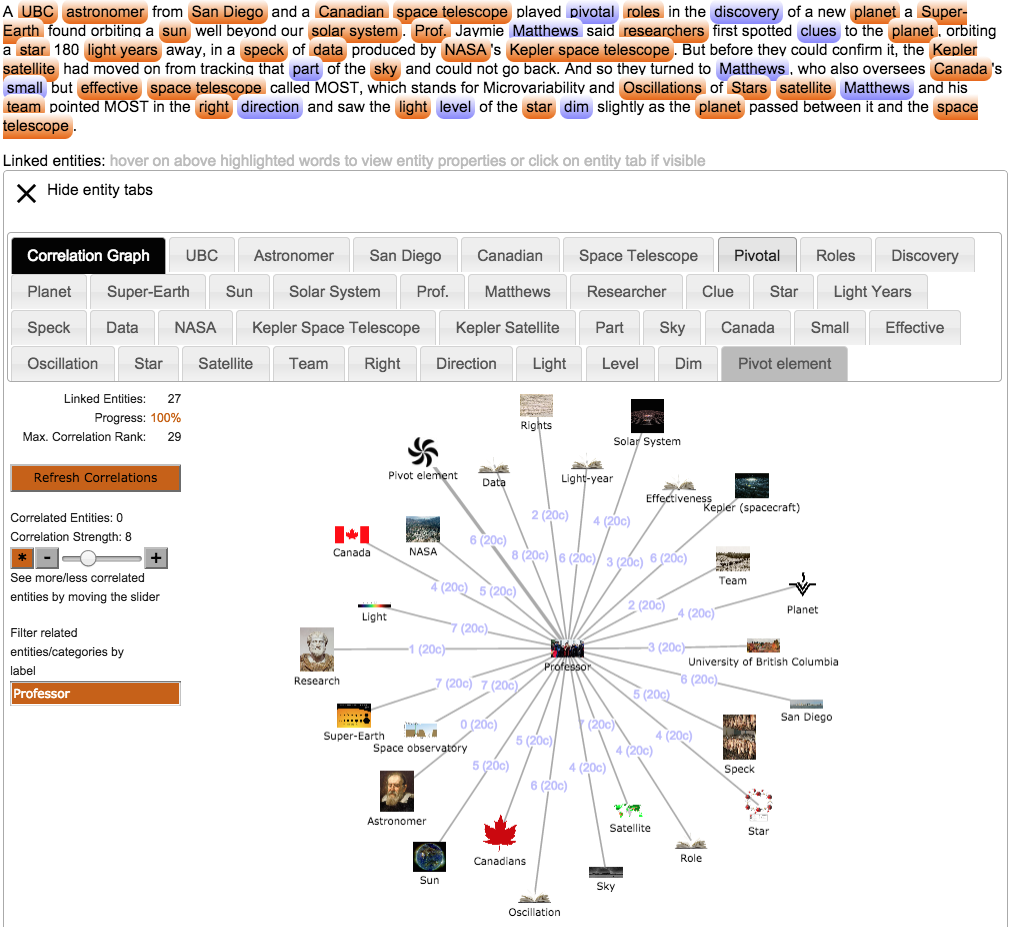
Figure 3: General correlation graph with view on “Professor” showing correlations with rank up to 8.
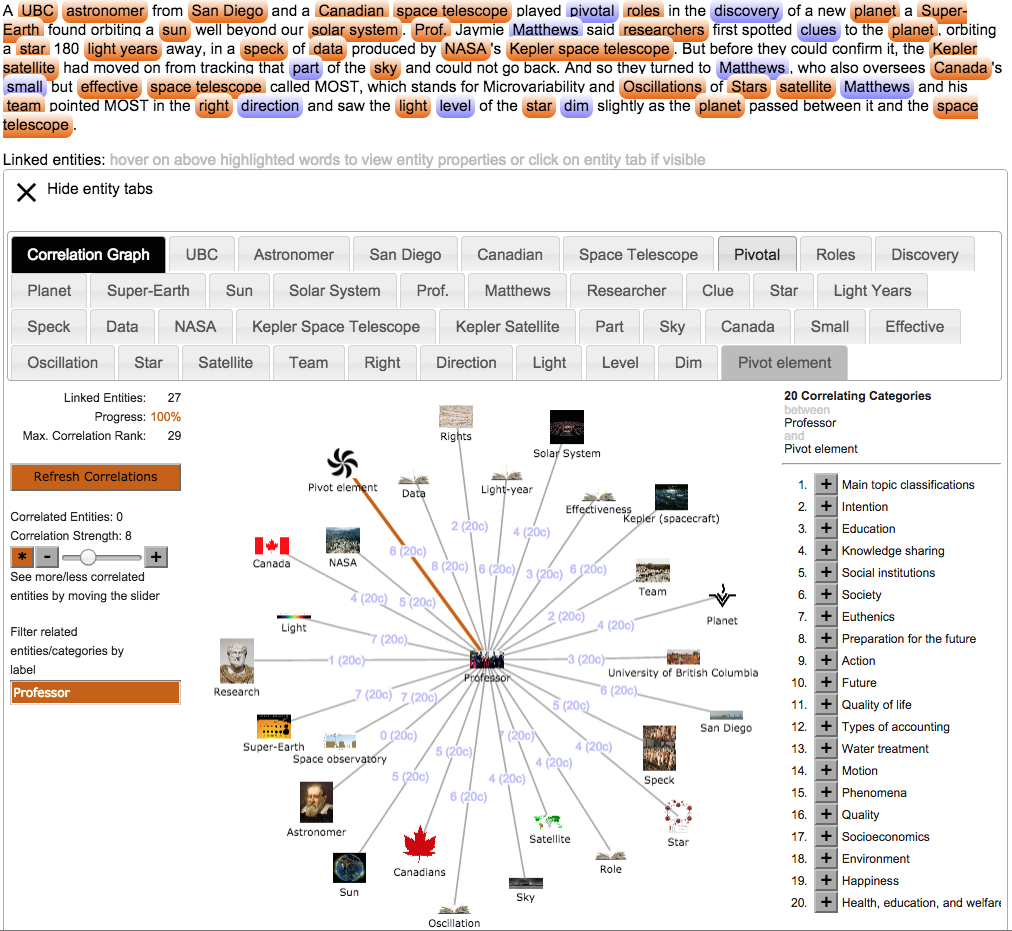
Figure 4: Viewing the MSC around the entity „Professor“ and its detailed correlation with “Pivot element”.
A further note on the quality of correlation results: using /SKOS/ categories bears the risk that too general categories be returned for entity pairs, which were found to be “very distant” (very high rank) in the correlation. On the other side, as shown in a previous blog, using categories for correlations delivers even for “weird” entity pairs like “Light” and “Economy” fully acceptable correlation results.
Since a correlation should here be computed between each pair of entities in a graph of n entities, the mathematical complexity of the algorithm reaches a combinatorial dimension k(n) computing in t(k(n)) time. At each combination a computation of the “skos:broader” transitive relationship t(b) is computed for each of the components (entity or category) in the combination. Since combinations contain repetitions (e.g. “a b”, “a c”, “a d”…) caching the computation t(b) for each component dramatically fastens the process to be practically polynomial t(p(n))=n*t(b)+x for an interesting number n of entities for which the combinatorial computing time t(k(n)) + t(p(n)) < s, that is: below a calculable threshold s for some positive s denoting the time we allow accepting t(k(n)) with respect to the computation speed t(b) of the transitive “skos:broader” relation in the SKOS model. Using the current implementation in /ELD2015/ I measured a fairly slow computation speed t(b) of about 3 seconds (*), which for 100 entities gives a total computation speed t(p(n)) = 300 seconds. Assuming and choosing s=120 seconds we get in t(k(n)) + t(p(n)) < 120 the expression t(k(n)) < 30 seconds. Assuming a real cache retrieval time of 100 microseconds for t(b) this allows for processing 300’000 combinations corresponding to n = 775 entities and a global computation time of 330 seconds.
(*) The computation time t(b) reflects the current implementation of the SPARQL computation of the transitive predicates in the used RDF engine. Here all transitive predicates are collected (even if just the first 300 would be enough for correlation work), thus bringing a big delay in delivering transitively the desired first 300 correlating predicates. The SPARQL recommendation currently does not suggest a “LIMIT” for transitive computations, only for result delivery. Limiting the length of the transitive exploration would help a lot in this context.
Alternative solutions
a) Every attempt to reproduce the work of the transitivity operator “+” in Java on the same machine led (me) to slower computation durations.
b) One (mature) solution to this bottleneck is loading the SKOS category portion into a GPU /GPU15/ and traversing on the fly the 300 correlating predicates for each entity to be correlated. GPU allow nowadays speeds up to 0.5 teraflop/sec for (limited portions) of graphs.
c) „Compiling“ the transitive 300 predicates for each category and storing them in a conventional relational database.
This blog showed a way how to semantically correlate several entities in a Knowledge Graph using the transitive relation “skos:broader” of a contained SKOS model. It furthermore reflected on one central aspect of SPARQL transitive computation in order to quickly compute correlations and suggested a LIMIT expression to be used to effectively fasten it. In the shown prototype, calculating the “right” allowable correlation rank in the shown correlation graph allows for more „contrast“ in discovering/rendering maximal strongly connected components in the correlations, thus helping to structure entity clustering. Although the used graph visualisation is an excellent instrument for visualising MSC’s, it seems not to be the most efficient way to represent correlations between entities. In further implementations, tabular or points views will be more efficient in order to focus on relevant entities groups.
The used SKOS knowledge representation in the Linked Data Source DBPedia /DBPEDIA14/ represents the maximal flexibility. Although the RDF engine used – Bigdata 1.4 /BLAZE15/ – delivers most efficiently RDF material in the Java embedded mode, its implementation of SPARQL transitivity seems not to be too appropriate for this task calculating transitively always the maximal closure, even if less elements are required. One improvement could be achieved by adding to each of the entities description one list of transitive broaders as text – thus shifting the complexity from time to space (memory). The second variant could be using adequate precompiled queries with SPARQL “PropertyPaths” avoiding the maximal transitive work of the used RDF Engine. The third improvement could be to use a real Graph Database Engine with the same RDF material in order to transitively navigate the „skos:broader“ relation in a considerably faster time.
| /BLAZE15/ | Blazegraph – http://www.systap.com/blazegraph |
| /DBPEDIA14/ | DBPedia – http://wiki.dbpedia.org/Downloads2014 |
| /ESCTL2012/ | An E-Science Tool for Managing Information in the Web of Documents and the Web of Knowledge (en) [J. Belmonte, E. Blumer, F. Ricci, R. Schneider] – IMCW 2012, Ankara, (T) |
| /GPU15/ | Large-Scale Graph Processing Algorithms on the GPU [SYSTAP] |
| /ELD2015/ | Entity Linker Demonstrator – http://semweb.ch/leistungen/rdfservices/en-entitylinking |
| /MSCSG/ | maximal Strongly Connected Components – http://en.wikipedia.org/wiki/Connectivity_(graph_theory) |
| /RDF/ | Resource Description Framework – http://www.w3.org/RDF |
| /RDFSE2013/ | Linking Search Results, Bibliographical Ontologies and Linked Open Data Resources (en) [F. Ricci, Javier Belmonte, Eliane Blumer, René Schneider] – MTSR, Thessaloniki (G) November 2013 |
| /SKOS/ | Simple Knowledge Organization System – http://en.wikipedia.org/wiki/Simple_Knowledge_Organization_System |
| /SPARQL/ | W3C SPARQL 1.1 recommendation – http://www.w3.org/TR/sparql11-query/ |
| /SWEL15A/ | Extraction of Semantic Correlations between Entities – https://ch.semweb.ch/de-blog/201503-discoveringentities/ |
| /SWEL15B/ | Extraction of Semantic Correlations between Entities – https://ch.semweb.ch/de-blog/201504-extractionofsemrelships/ |
| /VISJS/ | VISJS a visual graph implementation – http://visjs.org/ |