\"")
April 2015
Extraction of Semantic Correlations between Entities
This document is intended for an audience working with computer text assistance, which are using / seeking for details of linked entities in a knowledge graph starting from a natural language text. Please refer to a prior blog /SWEL15/ to get the basis of this discussion.
Nowadays we are literally overflown with notes, emails, documents, and news. The challenge often is to remain smiling while keeping the balance between our working duties and the information overflow, synthesizing – or even better: reading already synthesized – “essentials” on topics concerning our personal or enterprise focus. Since our “domestic robot” is not always able to prepare for us the needed pieces of information – most of us have to do it nowadays still by themselves. Couldn’t we be positively surprised by having – at reading time – automatically all the entities that piece of news is speaking about on a silver tablet completed by their definitions, details and related entities to be (on demand) browsed. That is what “Entity Linking” stands for: Recognizing rigorously and in a detailed way Entities in a knowledge graph from the piece of information which is just entering “the horizon” – a natural language text.
Once entities are linked we have the enormous advantage that all the information around them are also linked. The system leverages the information degree by showing (on demand) further linked entities: more entities get easily discoverable.
/AMPH12/ describes: ‘Essence’ is the Standard English translation of Aristotle’s curious phrase to „ti ên einai“, literally “the what it was to be” for a thing. This phrase so boggled his Roman translators that they coined the word essential to render the entire phrase, and it is from this Latin word that ours derives. Aristotle also sometimes uses the shorter phrase to ti esti, literally “the what it is,” for approximately the same idea. /WKPess/ says more concisely “In philosophy, essence is the attribute or set of attributes that make an entity or substance what it fundamentally is”. A further way of describing things besides their “Essence” is through the description of their “difference” from each other. /GRANG84/ cites “…differentia is the more important element in the definition… than genus”. Following these ancient thoughts I decided to shape a kind of correlation using two (or more) entities, which share some common proprieties and differ by some other particular ones. The idea of shared properties enforce focusing on the use of fitting properties because the graph space traversed for each entity is subject to intersections of properties of both (or of all involved) entities.
Correlating (two) entities inside an RDF space means in this work finding some shared and non-shared properties for the entity pairs.
Ontological defined spaces define each entity giving (any of) the following properties:
1) Attributes of the entity (like population for a city) – owl:partOf
2) Subparts of larger entities (like a table for a table-leg) – owl:partOf
3) Subparts entities (like a leg for a table) – owl:hasPart
4) Links to similar entities – owl:sameAs
5) Links to one or more categories – dcterm:subject
6) One or several types – rdfs:type
7) One or several relationships to other entities – “is dbpedia-owl:product of”
Since in the used DBPedia 2014 dataset the SKOS ordering of categories (position 5) resulted to be extensively done, I implemented a “Semantic Correlator” which extracts for a pair of Entities their shared and non-shared categories. Theoretically more than an Entity-pair, even all entities at once could be correlated/described in this way; this interesting scenario would generate a huge amount of data, which would be uneasily read/understood even in tricky graphical representations. I decided therefore to firstly adopt some “algebraic” reductions in order to have the smallest possible amount of concepts in one correlation frame containing a few correlations, as I will show in the next paragraph. To maintain usability I needed to put some limits on the number of correlation results: each correlation produces maximal ten shared and five non-shared categories. The correlation process is very close to a graph traversal, finding suitable categories in the SKOS hierarchy starting from the entities.
The Entity Correlator /ELD2015/ constructs for each of the linked entities one tab. Each tab presents two graphs named “Categories” and “Correlations”. The “Categories” graph was the original only graph of this Entity Linker. As input text I took the following astronomy piece of news:
A UBC astronomer from San Diego and a Canadian space telescope played pivotal roles in the discovery of a new planet a so-called Super-Earth found orbiting a sun well beyond our solar system. Prof. Jaymie Matthews said researchers first spotted clues to the planet, orbiting a star 180 light years away, in a speck of data produced by NASA’s Kepler space telescope. But before they could confirm it, the Kepler satellite had moved on from tracking that part of the sky and could not go back. And so they turned to Matthews, who also oversees Canada’s small but effective space telescope called MOST, which stands for Microvariability and Oscillations of Stars satellite Matthews and his team pointed MOST in the right direction and saw the light level of the star dim slightly as the planet passed between it and the space telescope.
In the new graph named “Correlations” the entity is put in the center and is bound through an arc to each of the linked disambiguated entities (*). Figure 1 shows an example of a “Correlations” graph for the entity “Sun” and figure 2 its maximized shape. As it is visible from both figures, *Sun” is “potentially” correlable with any of the linked entities, which were found analyzing the free text about Astronomy news. If all the potential connections of each theoretical entity pair were visualized, no room for further concepts would be exploitable. Since each tab has the own “Correlations” graph with its entity in the center, we do have a segmented and very practical graphical representation of a more complex space where several correlations can find place. Note: the initially depicted connections in this graph are purely “hypothetical” correlation connections, since we do not (yet) know whether there exists a semantic correlation between some of the pairs. Hypothetical correlation connections offer here just the kick-off for exploring correlations.
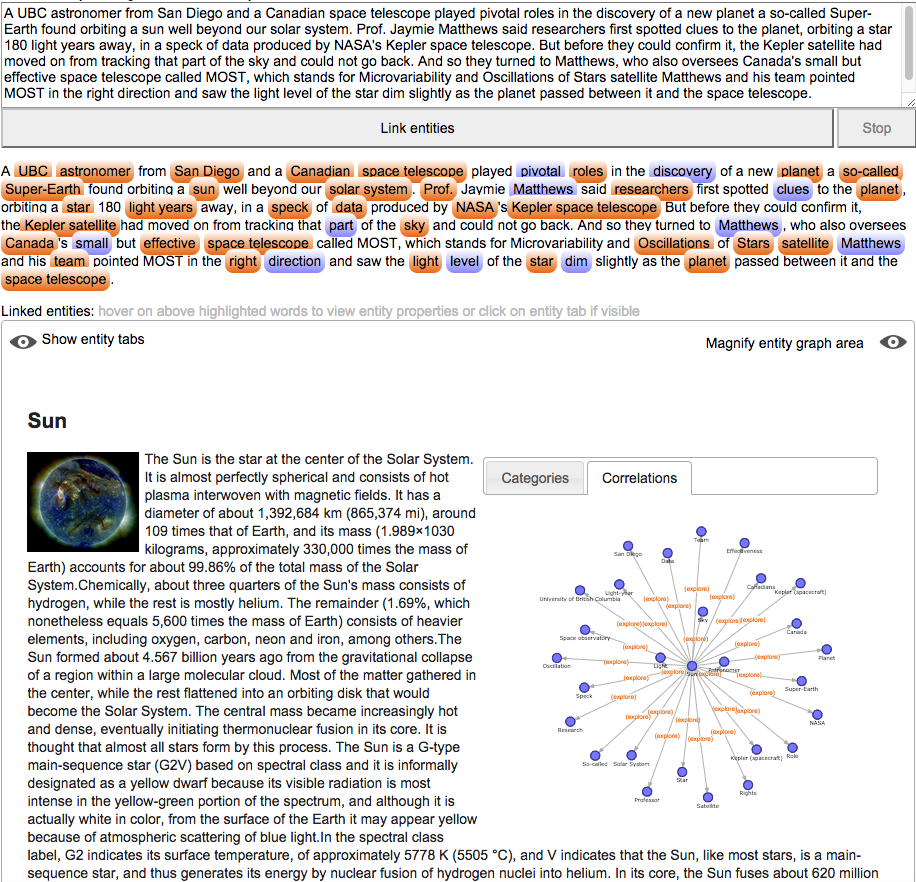
Figure 1 – „Correlations“ graph for “Sun”
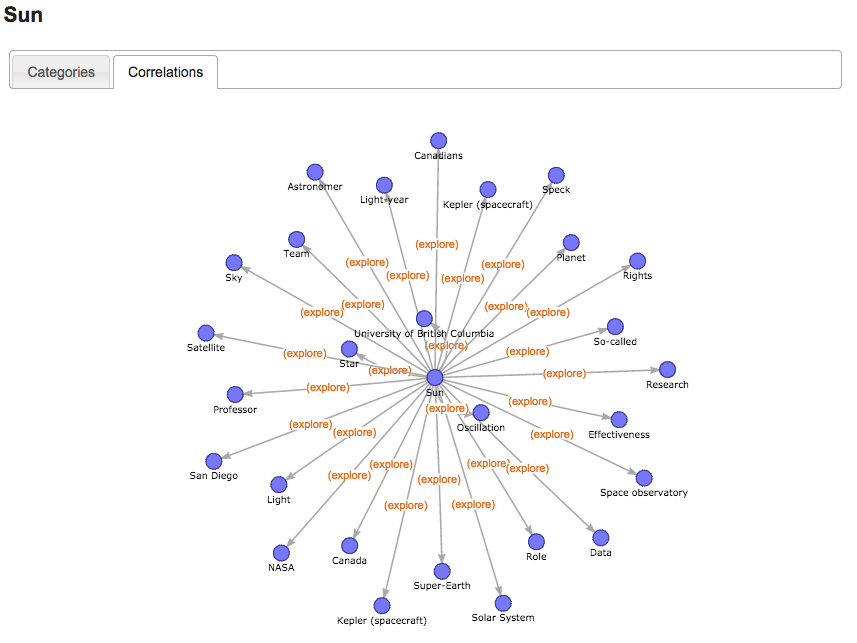
Figure 2: maximized “Correlations” graph for “Sun”
Imagine you want to explore the correlation between “Sun” and “Light” – The linker computes the following results:
Common to “Sun” and “Light” (common essence):
– Electrodynamics
– Electromagnetic_radiation
– Electromagnetic_spectrum
– Optics
– Waves
– Dynamical_systems
– Electromagnetism
– Radiation
– Applied_and_interdisciplinary_physics
– Applied_sciences
Special to “Sun” (differentia):
– Main-sequence_stars
– G-type_stars
– Astrophysics
– Transparent_materials
– Plasma_physics
Special to “Light” (differentia):
– Electrodynamics
– Electromagnetic_radiation
– Electromagnetic_spectrum
– Optics
– Waves
… reflecting how the two entities are correlated with respect to their categories. Note, that how the categories are organized influence the outcome of the correlation. Figure 3 depicts these correlation results shown graphically.

Figure 3: Parts of the correlation result between “Sun” and “Light”
A further normal expansion of each category in the graph can be triggered as in the other “Category” graph on each entity. Opening an entity shows the corresponding information in a new (dynamical created) tab and adds the new entity to each “Correlations” graph. Inversely closing a dynamical created tab will delete from each “Correlations” graph the sub graph corresponding to the tab entity. (*) Non-disambiguated entities should not appear in the “Correlations” graph hypothetical connected with the central entity since they are de-facto non-entities. The user has here the possibility to open one or several of its disambiguation’s entities until he/she gets a disambiguated subject (several steps might be necessary): this will add the disambiguated entity in every “Correlations” graph for each of the tabbed entities.
This blog showed a simple way, how to organize entities in order to be semantically correlated as described using several entity sub-graphs. It then showed how to extract shared and non-shared categories on a pair of entities. For the sake of usability and readability (concerning the “Correlations” graph) the number of results was limited to ten shared and five non-shared categories. Although the correlation results show a practicable quality of information their quality can be enhanced by additionally ranking the results. This correlation computation can be done on any n-tuple of Entities automatically by the system without user intervention. An instantaneous correlation computation of every entity pair in the system would require a faster RDF navigation system like RDF graphs running possibly on a GPU – thus processing tera-triples in seconds.
A further note on the quality of correlation results: using /SKOS/ categories bears the risk that too general categories be returned for entity pairs, which were found to be “very distant” in the graph. On the other side, using categories for correlations delivers even for “weird” entity pairs like “Light” and “Economy” fully acceptable results.
For a better focusing/filtering of categories or other essence parts a calculation using the more precise relation “rdf:type” is planned. Using “rdf:type” relation requires the type chaining between the types be continuous and transitively computable.
Graphical representation is a plus if and only if the depicted nodes can be easily manipulated by the user. Node display reduction filter could help here focusing on interesting subjects hiding the other nodes. The number of nodes easily processable by a user should be kept under 50 each graph at a time.
| /AMPH12/ | Aristotle’s Metaphysics – http://plato.stanford.edu/entries/aristotle-metaphysics/#SubEss |
| /BOAS2015/ | Blog on Ontology Assisted Search – http://semweb.ch/de-blog/en-blog201503challengesinsemanticsearch |
| /ESCTL2012/ | An E-Science Tool for Managing Information in the Web of Documents and the Web of Knowledge (en) [J. Belmonte, E. Blumer, F. Ricci, R. Schneider] – IMCW 2012, Ankara, (T) |
| /DBP2014/ | DBPedia 2014 – http://www.dataversity.net/dbpedia-2014-announced |
| /ELD2015/ | Entity Linker Demonstrator – http://semweb.ch/leistungen/rdfservices/en-entitylinking |
| /GRANG84/ | Edgar Herbert Granger: “Aristotle on Genus and Differentia” – Journal of the History Of Philosophy |
| /RDF/ | Resource Description Framework – http://www.w3.org/RDF |
| /RDFSE2013/ | Linking Search Results, Bibliographical Ontologies and Linked Open Data Resources (en) [F. Ricci, Javier Belmonte, Eliane Blumer, René Schneider] – MTSR, Thessaloniki (G) November 2013 |
| /SKOS/ | Simple Knowledge Organization System – http://en.wikipedia.org/wiki/Simple_Knowledge_Organization_System |